The numbers
The long-run charts the posts point back to, in one permanent place. Every line is built from a published series, with its start date noted under the chart. These are refreshed periodically, not live. The point is the long view, not the last tick. You can download the raw data under any chart and run the numbers yourself.
South African inflation, a century
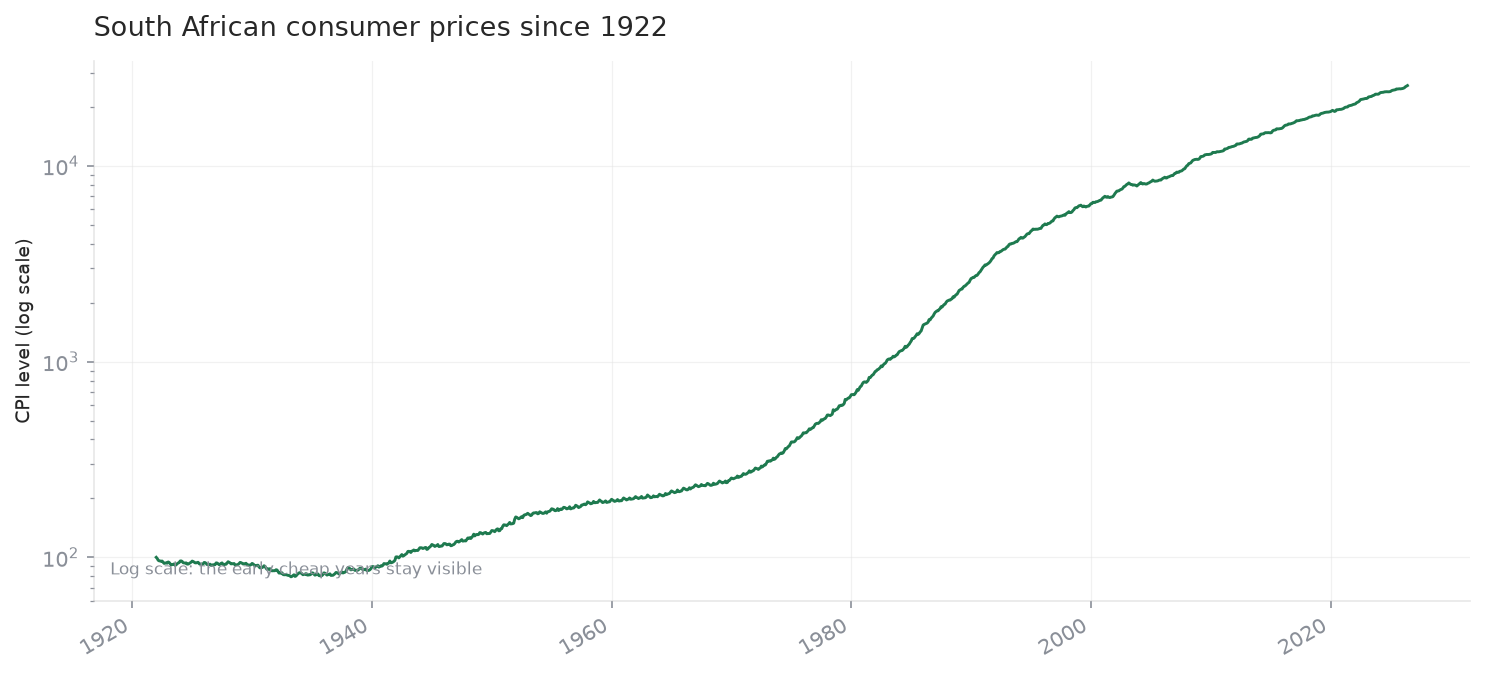
The CPI level since 1922, on a log scale so the early cheap years stay visible. The line climbs through every decade. What one rand bought you in 1922 takes many more today. Honest caveat: Stats SA's official index level only starts in 1980, so the pre-1980 levels here are chained backward from official year-on-year rates, not an official index.
Download the data · source: Stats SA CPI (rebased to Dec 2024 = 100)
The S&P 500, a century of real growth
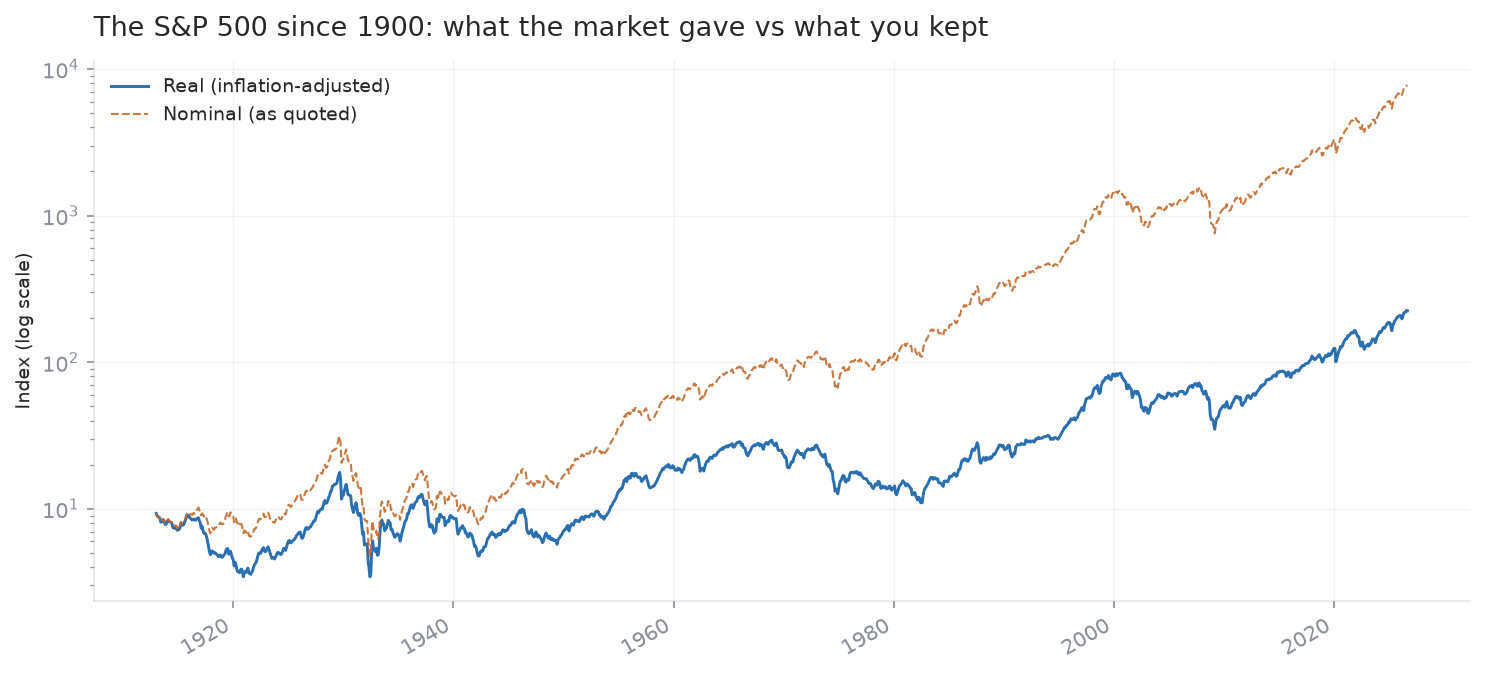
The real line is the honest one, and it is what you actually kept. The gap between green (real) and blue (nominal) by 2026 is inflation, the tax nobody puts on the quote. A chart that only shows nominal returns is showing you the market's gross.
Download the data · source: Robert Shiller's S&P data, real leg deflated with US CPI
The rand against the world
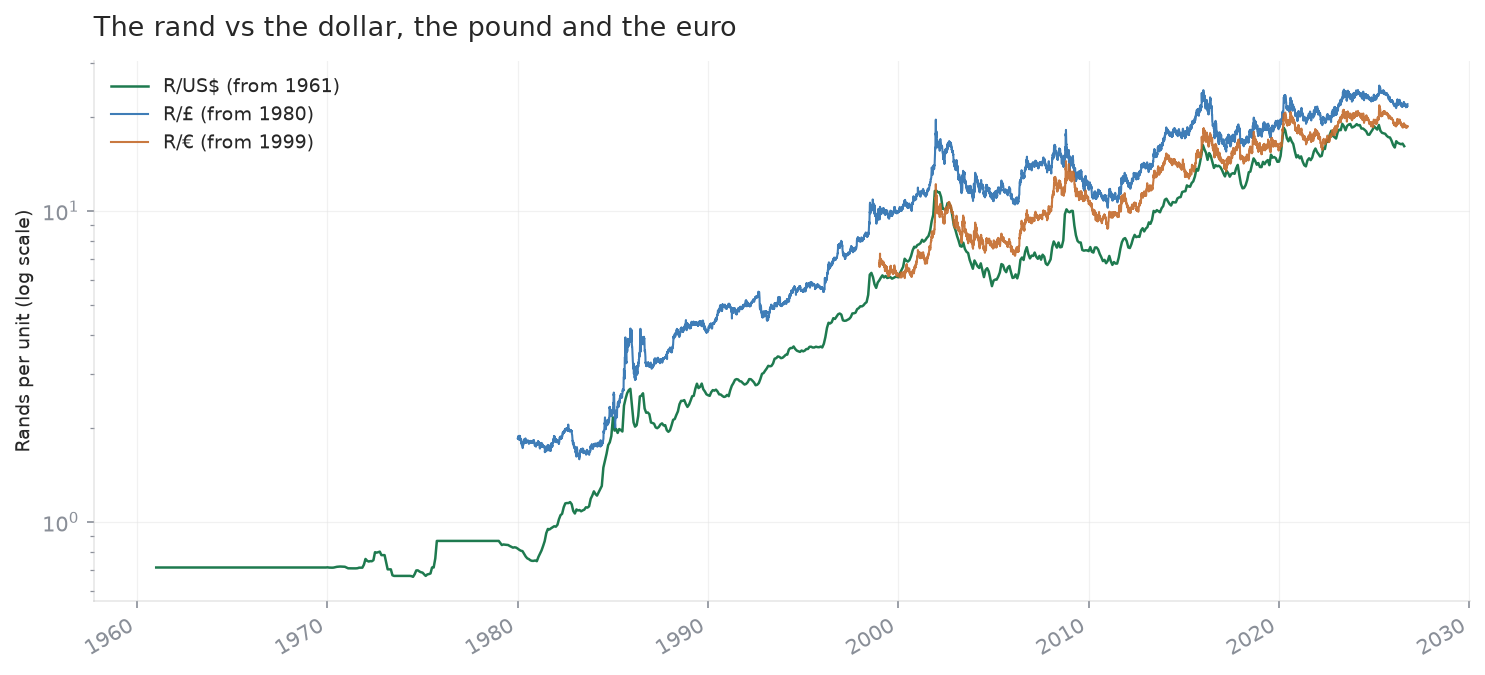
The rand only exists from 1961, and the euro only from 1999, so each line starts honestly. Against the dollar the rand sat below parity until the 1970s, then began the long slide. The pound and euro lines tell the same story from a different rung.
The JSE All Share
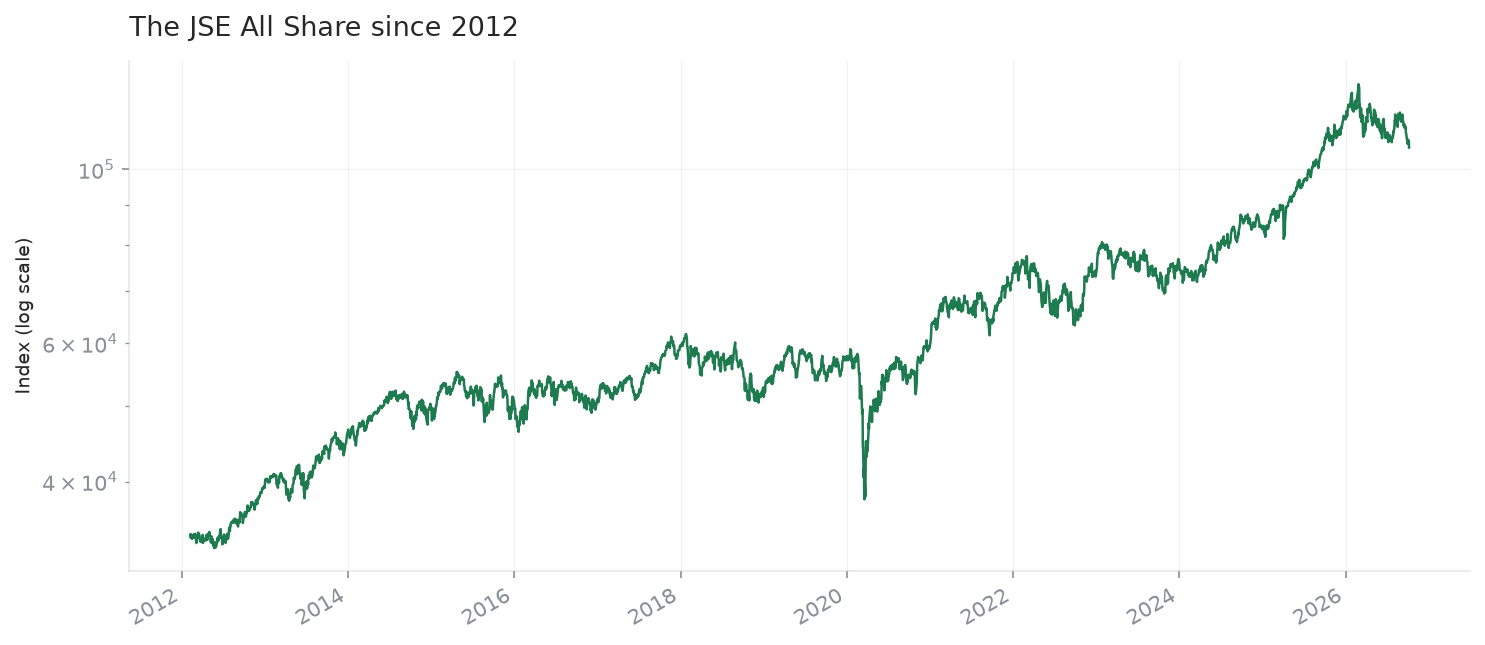
All Share, not Top 40. The Top 40 index only started in 2002, and the free download that reaches furthest back is the All Share from 2012. So this is recent history, honestly labelled, not a century.
Download the data · source: JSE daily index
SA lending rates
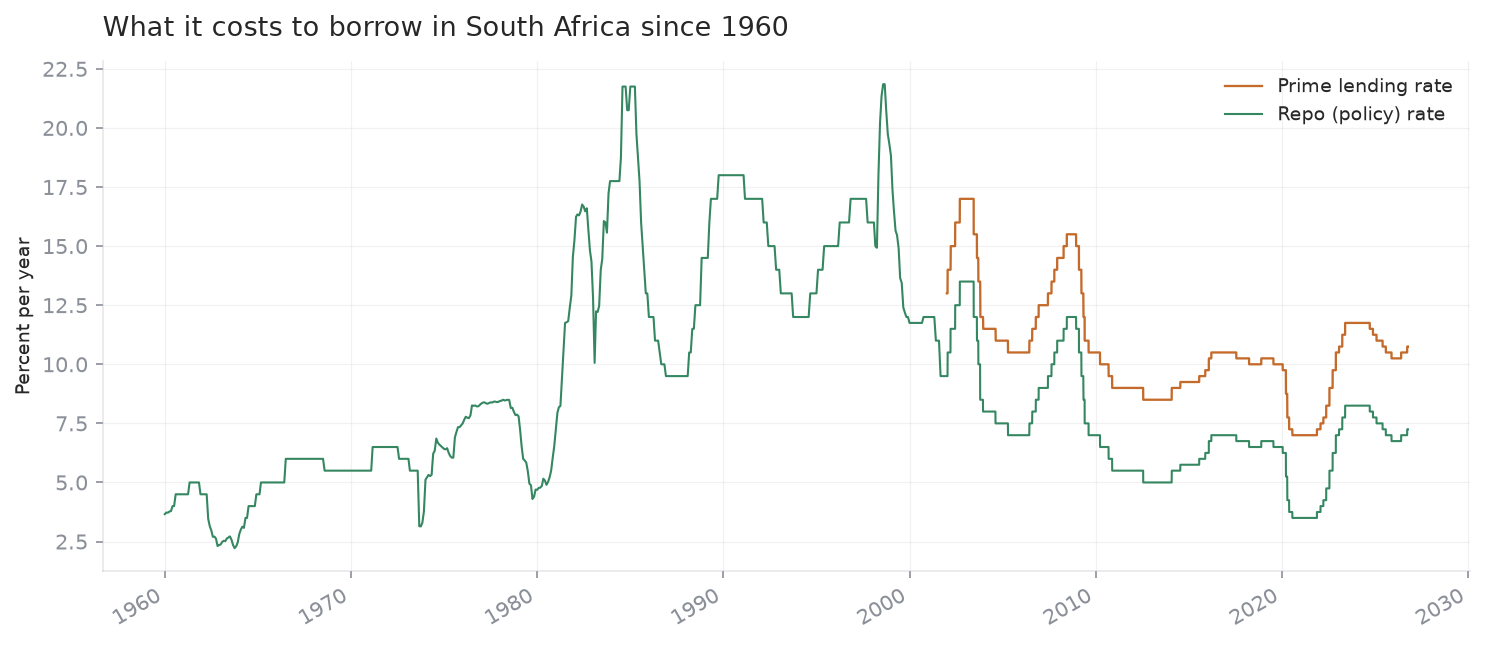
Repo is the Reserve Bank's policy rate; prime is what banks lend their best customers at. Prime tracks repo plus a constant margin. The spikes of the 1980s and 2000s are the storms that read calmer once the line flattens.
Download the data · source: SARB
Gold in rands
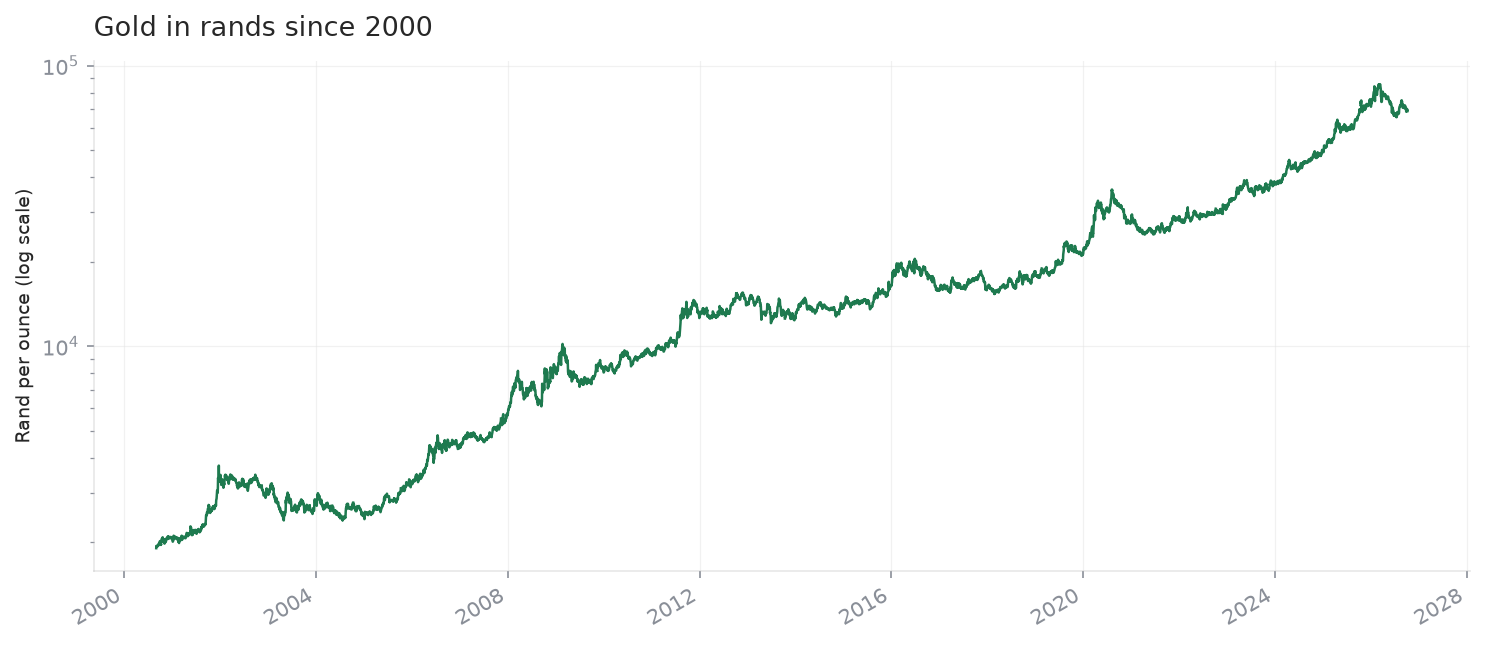
Gold priced in rands since 2000. The rand leg of the price is a big part of why gold swells in local terms even in flat years for the dollar price. For a South African audience this is the honest number, the one you actually see.
Download the USD data · source: LBMA gold, converted with ZAR/USD
The rand's purchasing power
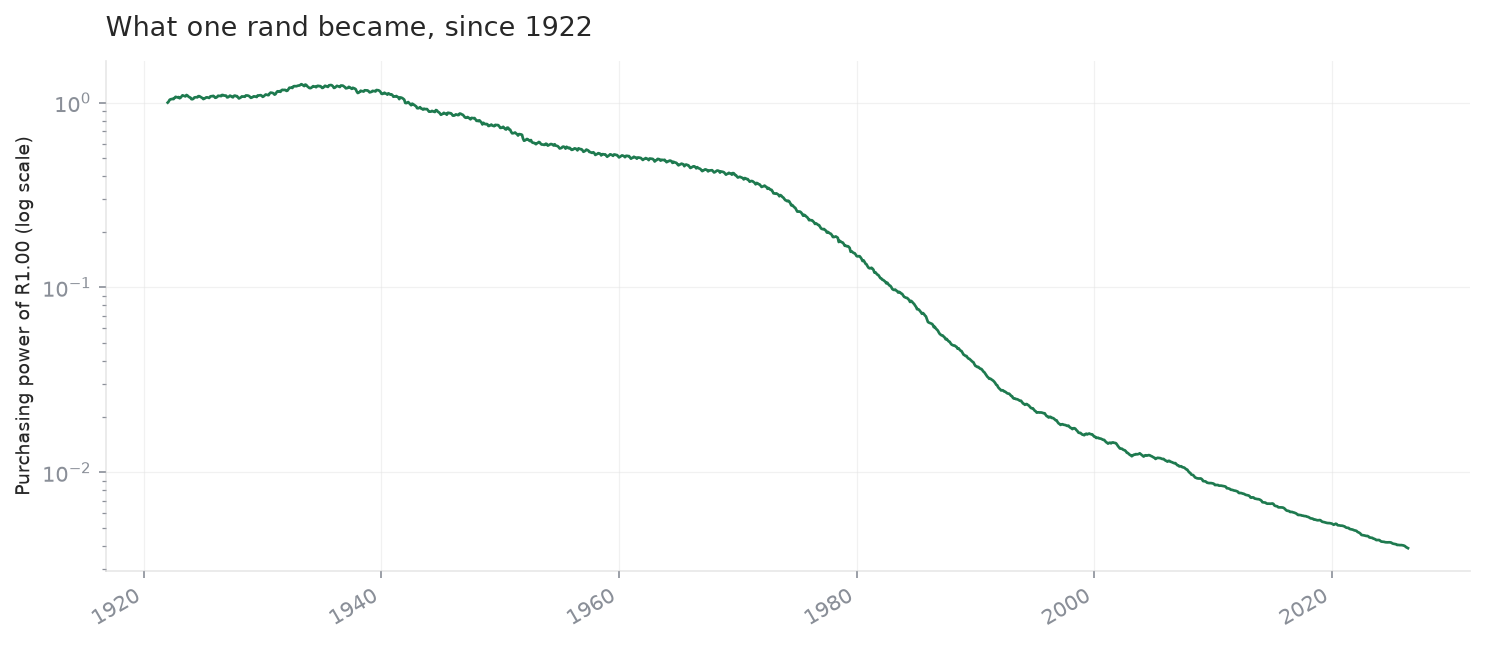
The journey of one rand, told flat. The line goes one way. It is the honest mirror of the inflation chart above.
Download the data · source: Stats SA CPI (rebased)
Crude oil vs what you pay at the pump
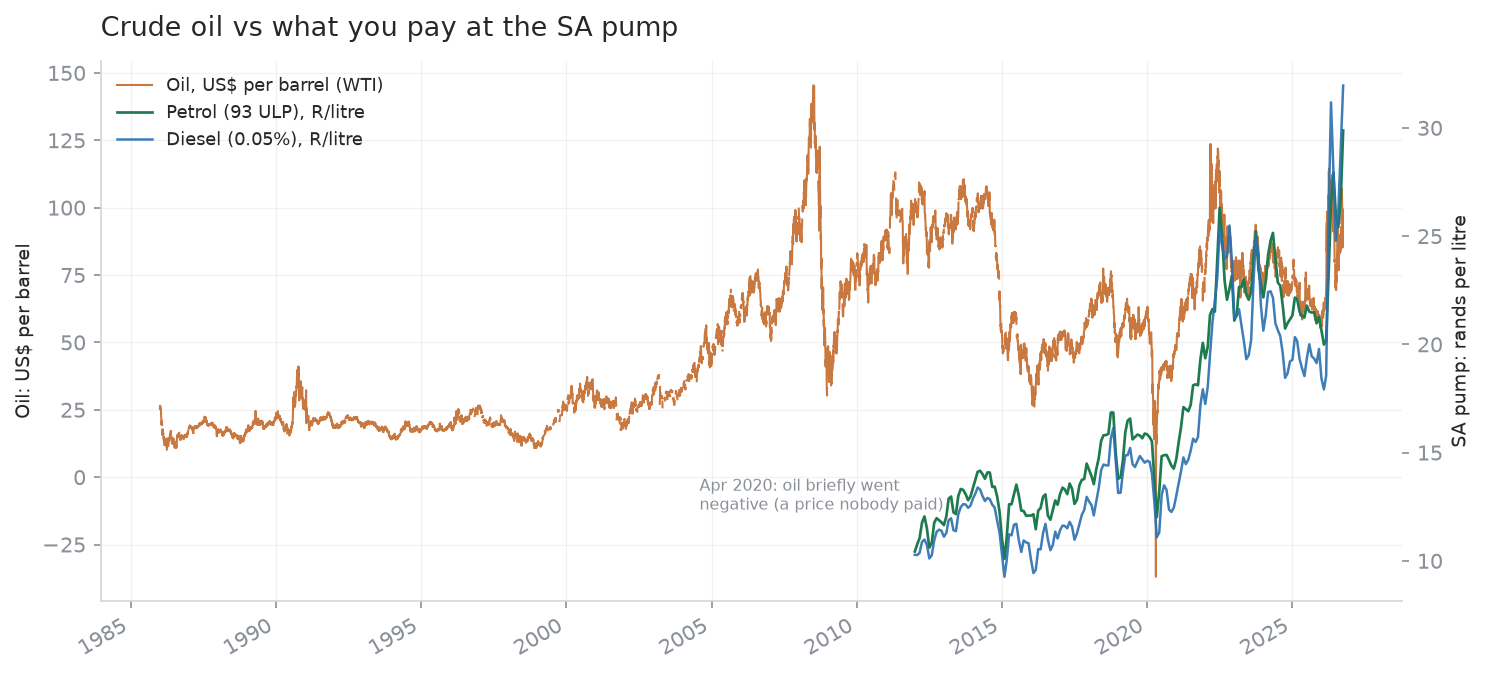
Oil in US$ per barrel (left axis), SA petrol and diesel in rands per litre (right axis), side by side since 2012. You can see the pump price fall when oil falls, and how slowly it comes back down. The sharp dip in 2020 is real: WTI briefly went negative in April 2020, a market quirk, not a pricing error.
Oil data · Petrol data · Diesel data · sources: EIA / FRED WTI; DMRE schedules via the Fuels Industry Association
log(1) = 0, log(10) = 1, log(100) = 2, log(1,000) = 3Now imagine a price that went R10 → R100 → R1,000 over thirty years. On a log scale you plot 0 → 1 → 2. Each rise is the same height, because each step was a tenfold (10×) rise. That lets a chart squeeze a 1,000× price range onto one axis without crushing the early years flat. To label the axis you just write the real number back (1, 10, 100, 1,000) under each tick; the reader never has to do the log, only the chart maker did.
Reading rule of thumb: on a log chart, a straight line upward is steady growth at a fixed percentage; a line curving over (flattening) is growth slowing down; a steep line or cliff is something doubling or collapsing fast. So when you see the S&P 500 or the rand on this page climb as a rough straight line, resist reading it as "slow, boring growth." It is compounding at a roughly steady rate, which over a lifetime is the whole game.